
50+ Real Estate Marketing Statistics: 2026 Report
The real estate sector moves faster every year. Guesswork destroys profit margins. You need exact data to plan your next big project.
Customer acquisition costs currently sit at record highs. Digital ad inflation hurts developer budgets daily. Yet, physical property demand remains incredibly high. India currently leads a historic market super-cycle.
We analyzed thousands of data points to build this guide. You will discover exactly where competitors spend their money. You will also learn the newest cost-per-lead data across Google and Meta. Read this guide to lower your acquisition costs, fix your digital funnel, and close more deals. Let's look at the numbers.
Global & Indian Market Reality
You must understand the physical market before you plan your digital ads. The health of the broader economy decides your strategy.
Interest rates remain a global challenge. Yet, the luxury real estate market remains very strong. High-end buyers still have cash ready to deploy. However, commercial markets face massive shifts.
Here are the critical supply and demand facts for 2026:
- Luxury Sales Grew 14%: High-end U.S. homes saw a 14% sales jump early this year.
- 4.02 Million Homes Sold: The national U.S. sales pace sits around 4.02 million units annually.
- $417,700 Median Price: U.S. home prices remain highly resilient despite rate pressures.
- 44 Days on Market: American homes stay on the market for roughly 44 days on average.
- Multifamily Focus Shifts: Landlords now spend more on keeping tenants than finding new ones.
- ₹50 Lakh Crore Absorption: The Indian market will absorb ₹50 lakh crore over the next decade.
- $1 Trillion Target: The Indian real estate sector aims to hit a $1 trillion valuation by 2030.
- ₹6.5 Lakh Crore Sales: Top Indian cities project ₹6.5 lakh crore in residential sales for 2025.
- Mumbai Leads Supply: Mumbai launched 40,000 new units, claiming 32% of top city supply.
- Bengaluru Tech Demand: Bengaluru launched 24,400 new units to meet tech-sector demand.
- Hyderabad Grew 46%: Hyderabad saw a massive 46% spike in new property launches.
- NCR Focuses on Luxury: Over 54% of new NCR launches cost more than ₹2.5 Crore.
- 86.4 Million Sq Ft Leased: The commercial office sector hit record global leasing numbers.
- Affordable Housing Dropped: Supply for homes under ₹40 lakh fell to just 10% of new Indian launches.
The data shows a clear divide. Affordable housing is disappearing in major markets. Developers focus heavily on luxury units because margins are better.
This forces marketers to target high-net-worth individuals exclusively. Selling luxury requires a polished brand. You cannot use cheap, low-quality ads to sell a ₹3 Crore apartment.
Budget & Spend Benchmarks
How much should you spend? The rules changed entirely this year. You must spend your money efficiently to fight rising platform costs. Chief Marketing Officers globally spend heavy percentages of revenue just to stay visible. New developers must spend even more to build initial trust.
Consider these budget facts before your next launch:
- U.S. CMOs Spend 21%: American marketing chiefs allocate 21% of total budgets to marketing.
- Early Developers Spend 20%: New builders spend up to 20% of revenue to build brand reach.
- 85% Goes to Digital: Early-stage developers put up to 85% of their budget into digital ads.
- Mature Builders Spend 10%: Established brands spend 7% to 10% of revenue.
- 50%+ Plan Increases: More than half of real estate marketers plan to increase budgets this year.
- 45% Paid Ads Ideal: A smart mid-sized budget puts up to 45% into Google and Meta ads.
Do not guess your monthly spend. You must reverse engineer your budget. Start with your final sales goal and work backward.
If you need 10 property bookings, calculate how many physical site visits you need. Then calculate how many digital leads create one site visit. Finally, multiply those leads by your average Cost Per Lead. This math removes all emotion from your budget.
Cost Per Lead Reality
Your Cost Per Lead (CPL) dictates your survival. The Indian market has very specific cost rules based on property ticket size.
Google and Meta classify real estate as a high-cost area. Your campaign needs enough budget data to learn what works. If you underfund your ads, the algorithms fail.
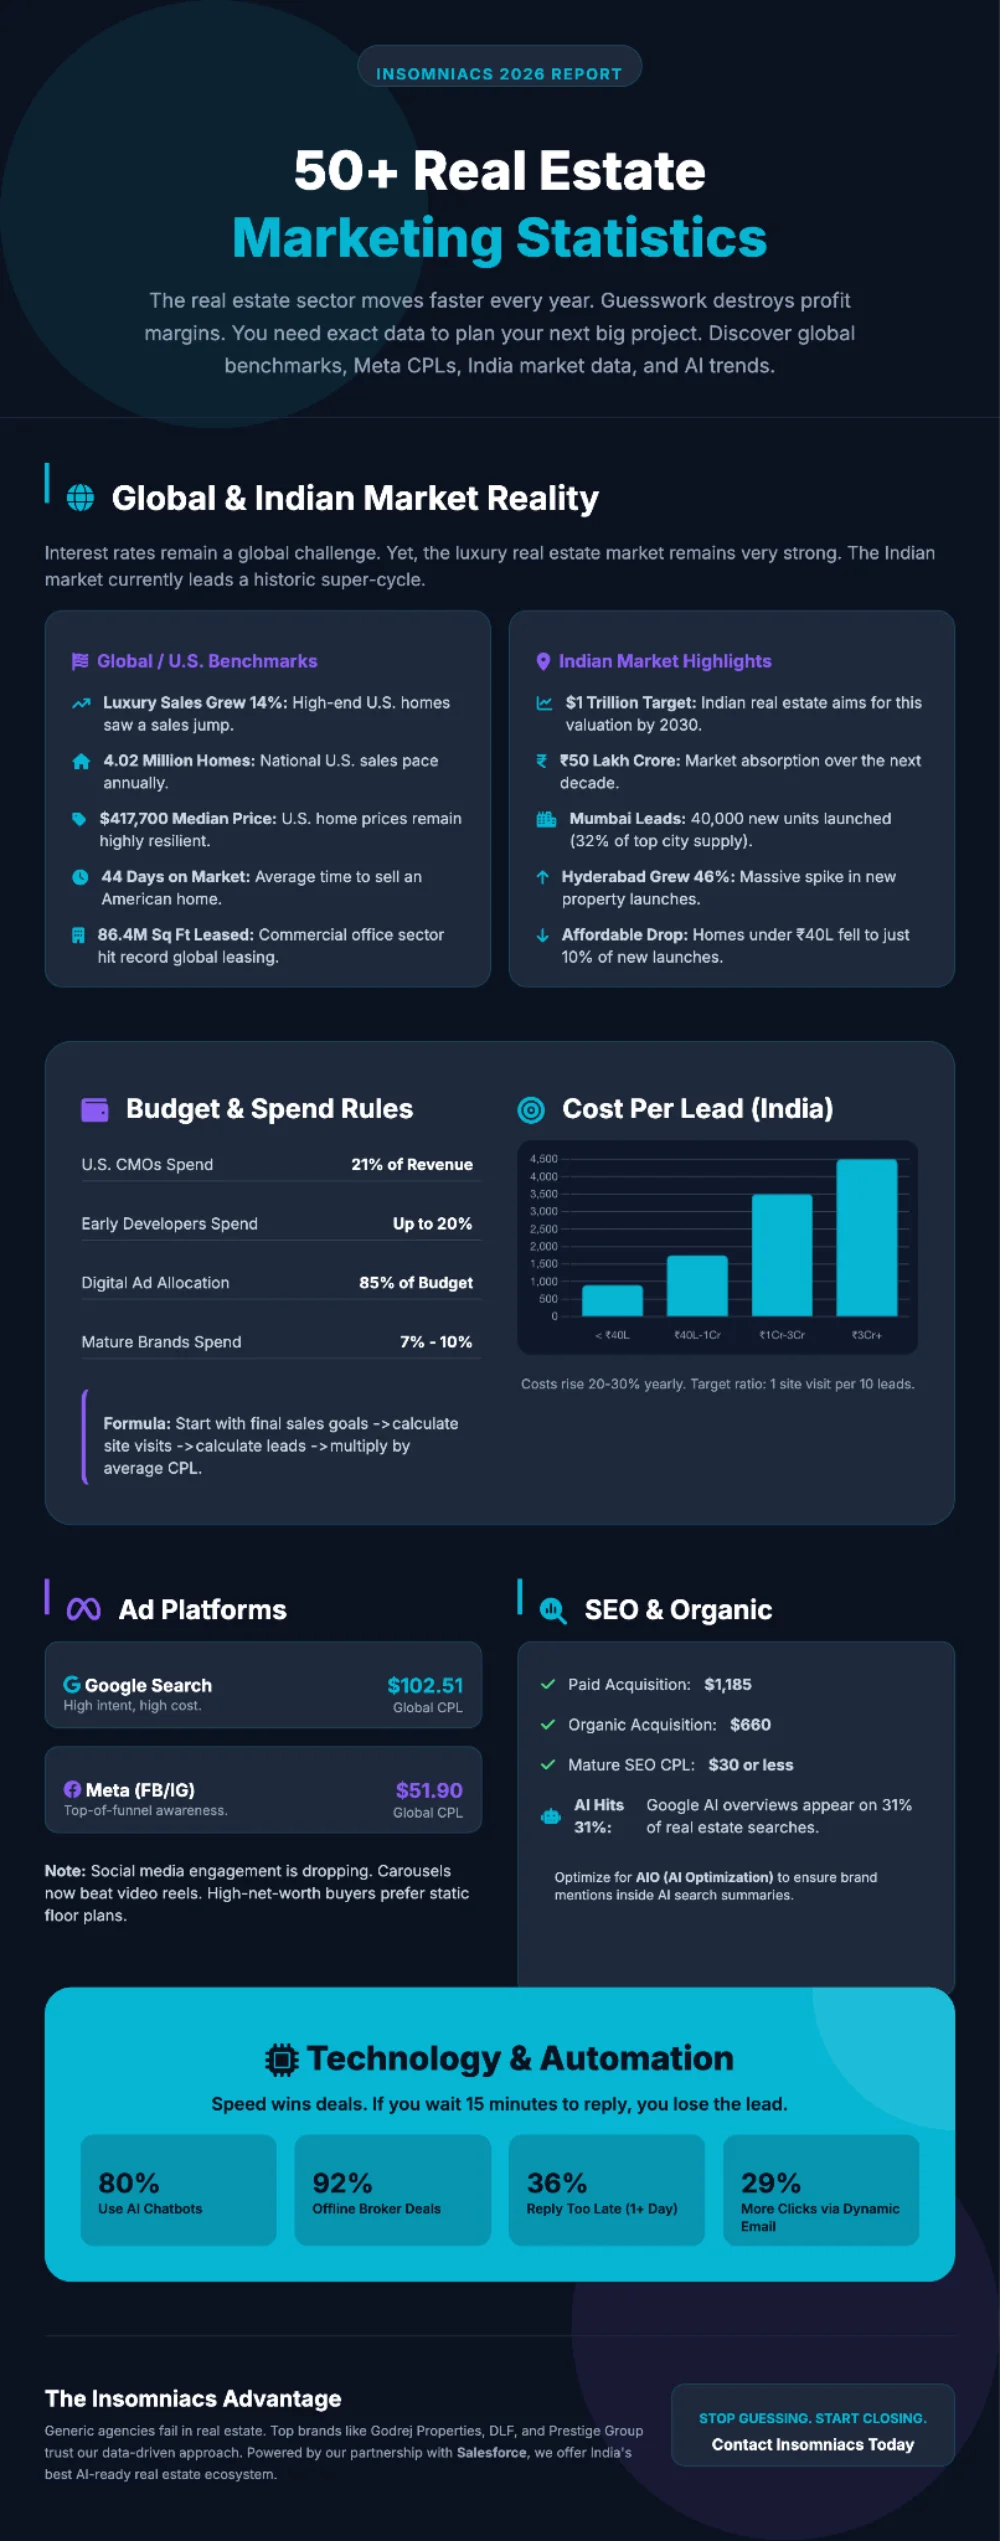
Here is the exact cost data you must expect:
- ₹40,000 Minimum Spend: Indian Google Ads need ₹40,000 to ₹80,000 monthly just to optimize.
- ₹100 to ₹300 Per Click: Average Indian real estate clicks cost between ₹100 and ₹300.
- Affordable CPL: Leads for homes under ₹40L cost between ₹500 and ₹1,300.
- Budget CPL: Leads for ₹40L to ₹1Cr homes cost between ₹1,000 and ₹2,500.
- Luxury CPL: Leads for ₹1Cr to ₹3Cr homes jump to ₹2,000 to ₹5,000 each.
- Ultra-Luxury CPL: Premium leads for ₹3Cr+ homes cost over ₹4,000 consistently.
- Costs Rise 30% Yearly: Indian developers face a 20% to 30% jump in acquisition costs yearly.
- 1 in 10 Goal: A site visit ratio of 1 for every 10 leads is excellent in India.
Customer acquisition costs face a true crisis. Costs rise nearly 30% every single year. You can no longer afford to buy junk leads. Track your lead-to-visit ratio closely. If you get 1 site visit per 40 leads, your targeting is broken. Stop the campaign immediately and fix your audience filters.
To combat these rising CPLs, you need hyper-targeted PPC Campaigns. Insomniacs manages high-performance Google and Meta ad campaigns specifically for real estate, ensuring every rupee targets high-intent buyers rather than wasted clicks.
Ad Platform Performance
Google Search captures high intent. People search exactly for what they want to buy. Meta (Facebook and Instagram) drives top-of-funnel awareness.
Both platforms suffer from severe cost inflation. Landing pages often fail to convert expensive traffic. Marketers must fix their post-click experience immediately.
Review these global platform benchmarks:
- 7.61% Click-Through Rate: Global real estate beats other industries with a 7.61% Google CTR.
- 3.70% Conversion Rate: Despite high clicks, the average search conversion rate remains low.
- $3.22 Cost Per Click: The global average cost for a single search click continues to rise.
- $102.51 Global CPL: The global Google Cost Per Lead now averages over $100.
- Google Beats Meta: Google leads convert at 4% to 8%, beating Meta's 1% to 3%.
- $51.90 Meta CPL: The global Meta Cost Per Lead hit $51.90 this year.
- $65+ City CPL: Meta leads in major global cities often exceed $65.
- X Engagement Dropped 48%: Engagement on X (Twitter) fell drastically this year.
- Instagram Dropped 16%: Instagram also saw a notable drop in overall user engagement.
- 3.70% IG Engagement Rate: Real estate accounts on Instagram average a 3.70% engagement rate.
- 3.20% LinkedIn Engagement: Professional networking on LinkedIn yields a 3.20% rate.
- Carousels Beat Reels: Static carousel posts now generate more engagement than video reels.
Social media engagement is dropping everywhere. You must fight harder for attention. Notice that carousel posts now beat video reels.
High-net-worth buyers like to swipe through floor plans at their own pace. They prefer detailed, static photos over fast, flashy videos. Give buyers the technical details they crave.
Organic Traffic & SEO Data
Paid ads get expensive fast. Organic search lowers your total acquisition cost. SEO creates a permanent business asset that generates free leads.
Content marketing offers the absolute best long-term value. However, artificial intelligence now changes how search engines display your website.
Here is the current state of organic search:
- $1,185 Paid Acquisition: A paid real estate customer costs $1,185 globally.
- $660 Organic Acquisition: An organic customer costs almost half at just $660.
- $30 Mature CPL: A mature SEO content engine can drive CPL down to $30 or less.
- 46% Ideal Bounce Rate: A healthy real estate website should see a bounce rate near 46%.
- 1 Min 34 Sec Dwell Time: Users spend an average of 94 seconds looking at property pages.
- AI Hits 31% of Searches: Google AI overviews appear on 31% of relevant search pages.
Google AI overviews push paid ads further down the screen. You must optimize your website for brand mentions inside these AI summaries.
You must optimize your website for AI search summaries to survive. Links inside AI overviews get incredibly high click rates. This is where Insomniacs' specialized SEO & AIO (AI Optimization) Services dominate. We do not just rank your website; we optimize your digital assets to be cited directly within Google's AI Overviews.
Technology & Automation
Speed wins deals. The PropTech market is massive, but developers still struggle with basic follow-up.
If a buyer submits a form, they expect a reply instantly. Artificial intelligence is no longer optional. It is mandatory for survival.
Consider these tech adoption facts:
- 15 Minute Rule: If you wait 15 minutes to reply, you likely lose the lead entirely.
- 36% Reply Too Late: Over 36% of businesses wait a full day to respond to leads.
- 80% Use Chatbots: Over 80% of real estate businesses now deploy AI chatbots.
- 46% Use AI Content: Almost half of agents use AI tools to write property descriptions.
- 88% Skip VR: Virtual reality sees low adoption; 88% of agents skip it for normal homes.
- 92% Offline Broker Deals: In India, offline channel partners still handle 92% of transactions.
- 29% More Clicks: Dynamic, personalized emails get 29% more clicks than static blasts.
Chatbots solve the speed problem easily. Buyers prefer chatbots for quick answers late at night. Chatbots find out budgets instantly and route hot leads to your human sales team.
Also, note the power of channel partners. In India, offline brokers still control the market. Your digital marketing must support your channel partners, not just your direct buyers.
The Insomniacs Tech Advantage
You need specialized tools to survive this complex market. Generic marketing agencies fail in real estate. Developers require end-to-end technology to close actual sales. Insomniacs bridges the gap between digital ads and physical site visits. Top brands like Godrej Properties, DLF, and Prestige Group trust our data-driven approach.
Furthermore, Insomniacs recently partnered with Salesforce. We launched India's absolute best AI-ready real estate ecosystem. We give developers the exact tools needed to lower costs and boost volume.
The era of cheap digital leads is permanently over. The real estate marketing statistics for 2026 prove that acquisition costs will continue to climb.
You must abandon useless vanity metrics. Focus heavily on complete funnel tracking. Invest in fast response tools like AI chatbots. Build your organic content daily to lower your blended costs over time.
Stop guessing with your marketing budget. Secure your next big launch with real data. Contact Insomniacs today and let our specialized tech ecosystem transform your sales pipeline.
Infographic
References
- National Association of Realtors (NAR): Annual Market Trends and Time-on-Market Data. Read the full report data here.
- Anarock Property Consultants: India Residential Market Reviews and Top City Launch Statistics. Access Anarock Research.
- Knight Frank India: India Real Estate Sector Valuation and Commercial Leasing Reports. Explore Knight Frank Insights.
- Gartner: Annual CMO Spend Survey and Budget Allocation Benchmarks. Review CMO Spend Data.
- WordStream by LocaliQ: Google Ads Industry Benchmarks (Real Estate CTR, CPC, and CPL). View Google Ads Benchmarks.
- Meta Business Insights: Global Real Estate Advertising Cost and Conversion Data. Explore Meta Data.
- Sprout Social: Social Media Industry Benchmarks (Engagement Rates across Instagram, X, LinkedIn, TikTok). Read Social Media Benchmarks.
- HubSpot: State of Inbound Marketing Trends (Organic vs. Paid Acquisition Costs). Access HubSpot Marketing State Report.
- Housing.com Research: PropTech Industry Growth and Technology Adoption in India. View PropTech Research.
- Mailchimp: Industry Average Email Benchmarks (Real Estate Click and Reply Rates). Read Email Marketing Benchmarks.
- Insomniacs Internal Data: First-party data on Indian Developer Budget Splits, Lead-to-Visit Ratios, and Tech Tool Response Lifts.